A major part of monitoring applications is managing the flow and wiring of data. When you deal with data, encoding, protocols, and standards come into play to make it easier to transfer, interpret, and ensure others can generate, send, or receive it seamlessly. As I mentioned before, every monitoring challenge can be broken down into four steps.
- Generate Data
- Collect Data
- Store Data
- Display Data ( Dashboards or Alerts)
This time, I’m going to focus on the "Generating Data" part. In monitoring standards, each application is responsible for exposing its own telemetry data. This data can include a variety of metrics. For example, imagine you’re developing a simple database app—you might want to track the number of requests hitting your instance, the number of transactions, the number of crashes, or even the usage rate of specific features. The type of data you collect really depends on the application you’re building. You can define these metrics based on your understanding of the app's business needs, input from the product team for analytics, or the data you and your development team need for troubleshooting.
Now that we know we need to expose our data, the next question is: how do we do it, and in what format? This is where Prometheus and OpenMetrics come into play. As you probably know, Prometheus is a time series database and metric scraper that collects and stores telemetry data as time series. But first, let’s take a closer look at what exactly a metric is.
Metrics represent a snapshot of the current state of a set of data. When stored in a time series database (TSDB), they allow you to view and analyze data trends over time. Metrics primarily focus on recording information about individual events, giving you valuable insights into how things change or behave.
For instance, "cpu_seconds_total" is a metric that shows the total CPU time spent in seconds, or "mem_free_bytes" is a metric that indicates the current free memory in bytes. Similarly, "request_total" tracks the total number of requests to your service. Essentially, any question that asks about the "number of something," "how much," or "when" regarding your application can be answered by metrics. If you need more detailed information about these events or data, you can always turn to logs.
You might think that you can answer all of these questions by using aggregation or full-text queries on logs. And yes, you can, but the issue is that dealing with logs isn't as straightforward. Logs require a lot of disk space and network bandwidth to handle, not to mention significant CPU power for full-text indexing. It’s not the most efficient approach, and it can be time-consuming to keep the data up-to-date and as close as possible to the current state of your application.
Now that we know what a metric is, let’s take a look at some examples. Here, I’m using the Prometheus Node Exporter. This exporter generates metrics about the operating system and hardware, and it’s a basic tool I install on any server or VM that I want to monitor.
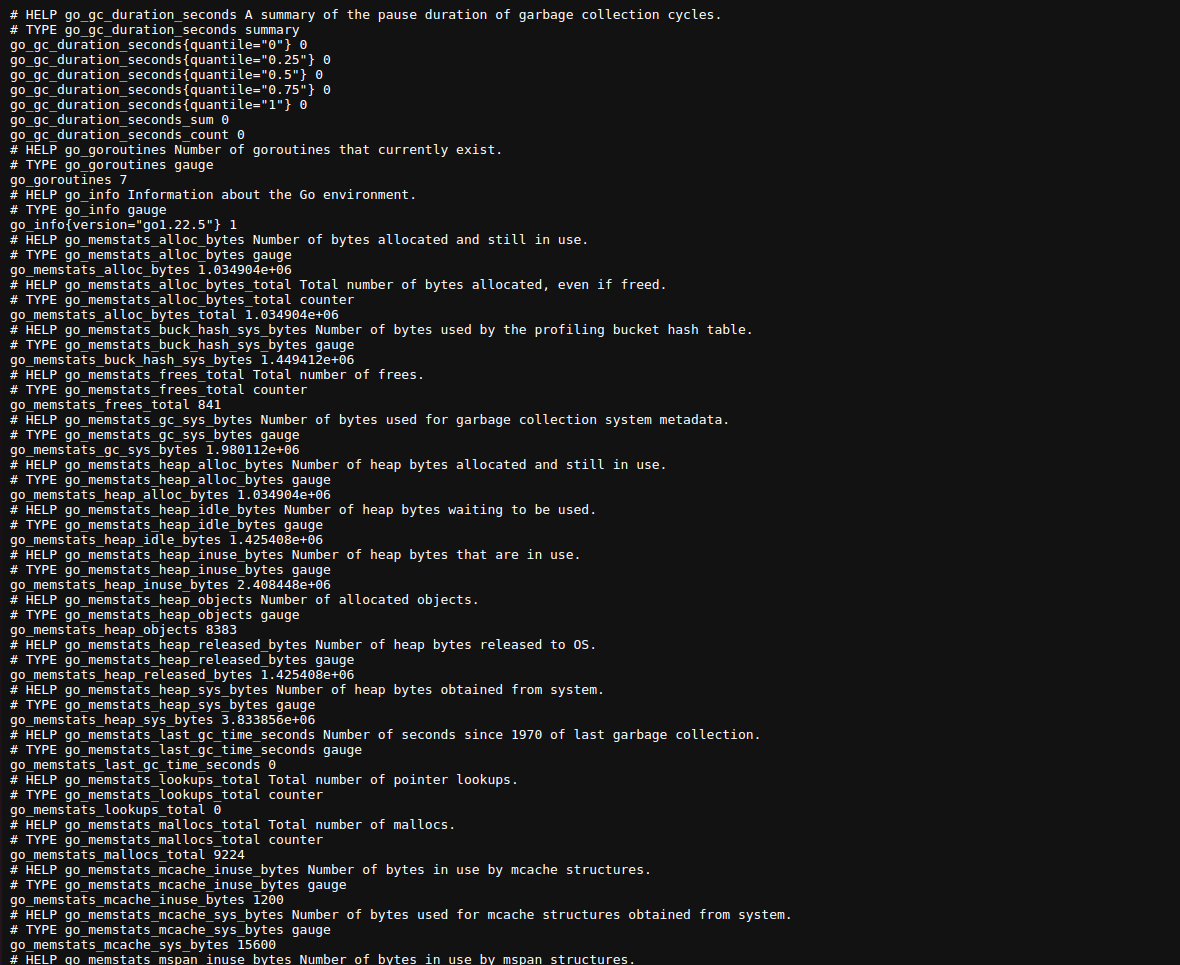
docker run -p9100:9100 quay.io/prometheus/node-exporterThen, open "localhost:9100/metrics" in your browser. You’ll see something like this:

These metrics reflect the current state of the OS and hardware on your system. As you refresh the page, you’ll see new data being generated. This is the data that Prometheus collects, and the format you're seeing is called the OpenMetrics format. Originally, this was just the Prometheus format, but as Prometheus became the default observability tool for CNCF, it was adopted as a standard. Now, this format is supported by numerous ingesters, exporters, and even OpenTelemetry.
OpenMetrics
Implementers MUST expose metrics in the OpenMetrics text format in response to a simple HTTP GET request to a documented URL for a given process or device. This endpoint SHOULD be called "/metrics". Implementers MAY also expose OpenMetrics formatted metrics in other ways, such as by regularly pushing metric sets to an operator-configured endpoint over HTTP.
The first rule is about where ingesters can find the data and what requests they can make to fetch it. As you can see, the Node Exporter implements the "/metrics" URL, and you can fetch the data by making a GET request, either through your browser or any HTTP client.
Values
Metric values in OpenMetrics must be either floating-point numbers or integers.
Booleans are represented as 1 for True and 0 for False.
Timestamps must be in Unix Epoch format, represented in seconds. Negative timestamps may also be used.
Labels are string key-value pairs, and empty labels are treated as if they were not present.
Metric names should be written in snake_case.
The metric types include "unknown," "gauge," "counter," "stateset," "info," "histogram," "gaugehistogram," and "summary." I’ll explain each type and its usage.
You must include the metric's unit and a HELP text that explains the metric.
You can find these rules in the Node Exporter's metrics. Let’s take a look at the "cpu_seconds_total" metric.

As you can see, we have a HELP text that describes the metric in human-readable terms, followed by the metric name and labels, such as "cpu" and "mode," and finally, the current value. Units can be represented in two ways: as a suffix to the metric name or as a UNIT text, as shown in the example below.

Now, let’s deep dive into the metric types and explore the usage of each one.
Metric Types
Gauge
Gauges represent the current measurement of a resource, usage, items, or similar metrics. For example, memory free bytes, the number of currently logged-in users, items inside a buffer, or the size of files. Gauges can increase or decrease over time, but the key point is that they are measurements, and their absolute value is important.
Counter
Counters measure individual events—things you can count one by one, where each event is independent of the others. For example, HTTP requests, errors raised by an app, times a feature is used by users, user logins or logouts, bytes sent, I/O bytes written, and so on. The key point with counters is that their rate over time is what matters to us. For instance, we may want to know which month of the year had the highest login rate or which feature was used the most. Counters typically have the "_total" suffix.
Info
Info metrics are used to represent text data about the current state of an application, and they must remain constant throughout the application's lifecycle. For example, application version or compiler version. These metrics are useful for comparing with other metrics over time. For instance, if we notice that memory usage increased when the app_version changed, it could indicate a problem with memory handling in the new version. Info metric names must end with the "_info" suffix.
Histogram
Histograms provide data about the distribution of individual events (counters). For example, if we have a counter for HTTP requests, we can use histograms to represent the latency of those requests. Histograms have buckets, sum, and count. Buckets are used to define ranges for the data, and they must end with the "_bucket" suffix, with a "le" label indicating the upper range of the bucket. The sum must end with "_sum," and the count ends with "_count." Here’s an example:
# HELP request_duration_seconds Histogram of request durations in seconds.
# TYPE request_duration_seconds histogram
request_duration_seconds_bucket{le="0.1"} 240
request_duration_seconds_bucket{le="0.2"} 450
request_duration_seconds_bucket{le="0.5"} 680
request_duration_seconds_sum 150.5
request_duration_seconds_count 1000
they will only increase over time.
GaugeHistogram
GaugeHistograms represent the distribution of values at a specific time, related to gauges. Like gauges, they are used to capture the current state. They have buckets with the "le" label, just like histograms. Essentially, they are histograms but for gauges. The sum ends with "_gsum," and the count ends with "_gcount."
# HELP memory_usage_gauge_histogram Distribution of memory usage in MB at a specific moment.
# TYPE memory_usage_gauge_histogram gauge_histogram
memory_usage_gauge_histogram_bucket{le="128"} 10
memory_usage_gauge_histogram_bucket{le="256"} 20
memory_usage_gauge_histogram_bucket{le="512"} 30
memory_usage_gauge_histogram_gsum 20000
memory_usage_gauge_histogram_gcount 60
they can increase or decrease over time
StateSet
StateSets are used to represent values across different states, using labels. For example:
# HELP task_states Current state of tasks.
# TYPE task_states stateset
task_states{state="pending"} 5
task_states{state="running"} 2
task_states{state="completed"} 10
For all of these metric types, you can provide a timestamp indicating when the metric was measured. For example:
free_memory 5 1234
free_memory 10 1456
We can represent that memory usage was 5 at timestamp 1234 and 10 at timestamp 1456.
Now that we know the metric types, let's explore some examples from the Node Exporter's metrics.

We have node_memory_MemAvailable_bytes, node_memory_MemFree_bytes, and node_memory_MemTotal_bytes, all with the type of gauge.

Here, we have node_cpu_core_throttles_total, which is of the counter type.

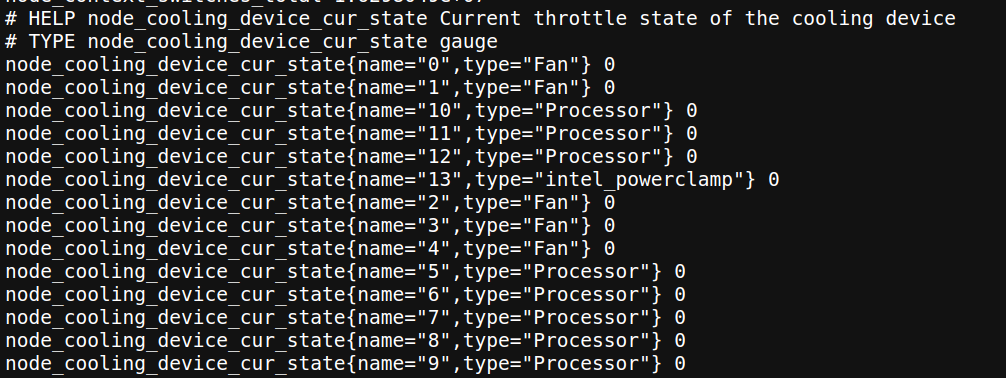
This metric shows the state of each cooling device on my laptop, with the type of gauge. You might consider that, based on the data types we discussed, the suitable metric type for this would be a StateSet. As you can see, you can use different metric types in place of each other, but choosing the appropriate type helps you create better reports and improves the readability of your metrics.
Conclusion
Many of us have been using Prometheus without fully understanding the different metric data types and their use cases, but I believe a deeper understanding of them is essential—especially when you want to generate metrics yourself that provide meaningful, actionable data for monitoring services. By choosing the right metric types, you ensure that the data you collect is not only accurate but also valuable. This can significantly improve your application’s reliability, performance, and business outcomes.
When you create well-defined and standardized metrics, you give both your team and any external ingesters the confidence to collect the right data, minimizing the risk of errors or misinterpretations. This process also facilitates better troubleshooting, as it allows you to quickly pinpoint issues. Additionally, the data you gather can be leveraged for more in-depth analytics, providing insights into your application's usage patterns, performance bottlenecks, or potential improvements.
Ultimately, understanding and applying these metric data types isn't just a best practice; it’s a key element of building a robust monitoring strategy that supports your application's long-term success and scalability.
Thank you so much for taking the time to read through this! I hope you found the information helpful in understanding how to use Prometheus and OpenMetrics more effectively. If you have any questions or thoughts on the topic, feel free to reach out—I’d love to hear your feedback or discuss it further.
