Monitoring applications is a huge area in DevOps and SRE. You’ll encounter tons of data types, technologies, and tools, which can easily overwhelm you with questions like: What tool should I use? What data should I monitor? What kind of dashboards should I create? Where should I store the data? How can I access it?
To be honest, there’s no short answer to these questions. I remember feeling completely lost the first time I faced monitoring requirements. But I’ve learned that if you break down the needs of the dev, product, and support teams, tackle them one by one, and refine your approach over time, you’ll eventually build a solid and efficient monitoring structure for both your applications and infrastructure.
Now, let’s talk about one of the very first monitoring requirements our DevOps team encountered. The question was simple: Can customers reach their services or not? In other words, is the service "UP" or "DOWN"? Of course, this doesn’t mean that every single feature or service inside the application is working perfectly. It simply means that the overall service is available to users—they can open the URL in their browser and see the login or home page.
This is what’s known as an application "Heartbeat" in monitoring. It’s also how we calculate uptime SLAs. Heartbeat monitoring is crucial because it helps us respond quickly to incidents, maintain our uptime SLA, and address downtime issues even before customers call support.
If you want a quick and easy way to solve this requirement, you can write a simple script that takes your service endpoints as input and periodically checks their URLs. Here’s a basic code example:
package main

import (
	"fmt"
	"net/http"
	"time"
)

func main() {
	// List of URLs to check
	urls := []string{
		"https://example.com",
		"https://google.com",
		"https://thisurldoesnotexist.com",
	}

	// HTTP client with a timeout
	client := &http.Client{
		Timeout: 5 * time.Second,
	}

	// Iterate over URLs and check their status
	for _, url := range urls {
		status := checkURL(client, url)
		fmt.Printf("%s: %s\n", url, status)
	}
}

// checkURL sends a GET request to the URL and returns "UP" or "DOWN"
func checkURL(client *http.Client, url string) string {
	resp, err := client.Get(url)
	if err != nil {
		return "DOWN"
	}
	defer resp.Body.Close()

	if resp.StatusCode == http.StatusOK {
		return "UP"
	}
	return "DOWN"
}
But let’s take it a step further and aim for a more standard, production-ready solution. Most monitoring setups typically follow four key steps:
- Generate Data
- Collect Data
- Store Data
- Create Dashboards or Alerts
I’ll start by outlining the big picture of what we’re going to build and then break it down step by step.

Let’s say I have lots of services, and I want to ensure they’re accessible to users. The first component we’ll use is the Prometheus Blackbox Exporter. It sends requests to your services to check whether they’re UP or not. This tool is similar to the script we wrote earlier but comes with a rich set of features specifically designed for this job. From my experience, two great tools for this are Elastic Beats and Prometheus Blackbox Exporter. I chose Blackbox Exporter because it’s lightweight, open-source, and integrates seamlessly with Prometheus.
The second component is Prometheus, one of the major monitoring tools used across a wide range of services. Prometheus is a metric scraper and time-series database that allows you to collect metrics data, store it, and then retrieve it using PromQL, its query language. With PromQL, you can perform various aggregations or calculations, such as sum, average, rate, and more.
Prometheus BlackBox Exporter
First, let’s dive a bit deeper into the Blackbox Exporter. As the name suggests, this tool treats your application as a black box, only exporting data from external endpoints. The great thing about this approach is that you don’t need to modify any code to generate the data, so it doesn’t matter what type of service you're monitoring.
It supports various protocols like HTTP, HTTPS, DNS, TCP, ICMP, and gRPC. To use it, you can either download the binary, build the code yourself, or simply use the Docker image.
To run this exporter, you’ll need to write a configuration file that defines how your API should respond and what constitutes a successful or failed response. Here’s an example from the Blackbox Exporter repo:
modules:
  http_2xx_example:
    prober: http
    timeout: 5s
    http:
      valid_http_versions: ["HTTP/1.1", "HTTP/2.0"]
      valid_status_codes: []  # Defaults to 2xx
      method: GET
      headers:
        Host: vhost.example.com
        Accept-Language: en-US
        Origin: example.com
      follow_redirects: true
      fail_if_ssl: false
      fail_if_not_ssl: false
      fail_if_body_matches_regexp:
        - "Could not connect to database"
      fail_if_body_not_matches_regexp:
        - "Download the latest version here"
      fail_if_header_matches: # Verifies that no cookies are set
        - header: Set-Cookie
          allow_missing: true
          regexp: '.*'
      fail_if_header_not_matches:
        - header: Access-Control-Allow-Origin
          regexp: '(\*|example\.com)'
      tls_config:
        insecure_skip_verify: false
      preferred_ip_protocol: "ip4" # defaults to "ip6"
      ip_protocol_fallback: false  # no fallback to "ip6"
In the configuration, you define modules, and each module specifies a probe with various options. For example, the following configuration sends an HTTP GET request with defined headers, a 5-second timeout, follows redirects, ignores SSL errors, fails if the body matches certain regexes, and prefers IPv4 for the IP protocol lets see another example:
http_basic_auth_example:
    prober: http
    timeout: 5s
    http:
      method: POST
      headers:
        Host: "login.example.com"
      basic_auth:
        username: "username"
        password: "mysecret"
This module sends a POST request to your targets with Basic Auth, which is useful if you don’t want to expose your probes’ API. For instance, you may want to check some private data or run queries against your database to monitor your system’s health, but it’s not safe to expose that API to the public.
Now, let’s say your services are simple, and all you need is a 200 HTTP response to assume your service is healthy, and you don’t care about SSL. In that case, your Blackbox Exporter configuration would look something like this:
modules:
  http_2xx:
    prober: http
    timeout: 5s
    http:
      method: GET
      valid_http_versions: [ "HTTP/1.1", "HTTP/2.0" ]
      valid_status_codes: []  # Defaults to 2xx
      follow_redirects: true
      fail_if_ssl: false
      fail_if_not_ssl: false
      preferred_ip_protocol: ip4
You’ll need to mount this configuration inside the Blackbox Exporter container and pass it to the Blackbox process using the --config.file argument. To do this, I wrote the following Docker Compose configuration:
services:
  blackbox-exporter:
    image: quay.io/prometheus/blackbox-exporter:v0.25.0
    ports:
      - "9115:9115"
    volumes:
      - ./conf/blackbox/config.yml:/etc/blackbox_exporter/config.yml:ro
    command:
      - '--config.file=/etc/blackbox_exporter/config.yml'
    restart: always
The file structure goes as follows
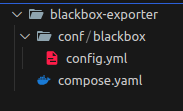
Now, if you run the Compose setup and open port 9115 in your browser, you should see something like this:
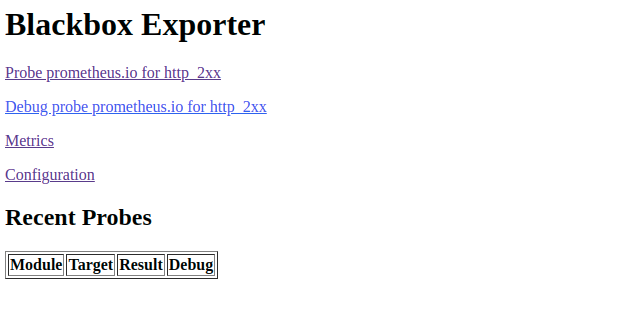
Hooray! The first step is done — we now have probes set up. Next, we need to pass our targets to the Blackbox Exporter and collect the responses, which we’ll do with the help of the almighty Prometheus. You can define your endpoints in the Prometheus scrape config, which would look something like this:
global:
  scrape_interval:     15s # By default, scrape targets every 15 seconds.

scrape_configs:
  - job_name: 'blackbox'
    metrics_path: /probe
    params:
      module: [http_2xx]  #  'http_2xx' module from the Blackbox Exporter configuration

    static_configs:
      - targets:
        - http://hadijafari.me   # Target to probe with http.

    relabel_configs:
      - source_labels: [__address__]
        target_label: __param_target
      - source_labels: [__param_target]
        target_label: instance
      - target_label: __address__
        replacement: blackbox-exporter:9115
In this scrape config, we set the interval to 15s and define a job named "blackbox". We specify that this job must use the "http_2xx" module, which we defined in the Blackbox Exporter config. You can define multiple modules and configure multiple jobs to use them as needed.
In the static_configs section, you’ll list your target endpoints. In this case, I’ve just added my blog URL, but you can add as many targets as needed. If your targets are more dynamic, you can also use Prometheus service discovery to automatically detect them.
Now, we need to add Prometheus to our Compose file and pass the scrape config to it.
services:
  blackbox-exporter:
    ...
  prometheus:
    image: prom/prometheus:latest
    volumes:
      - "./conf/prometheus/prometheus.yml:/etc/prometheus/prometheus.yml"
    ports:
      - 9090:9090
    command:
      - '--config.file=/etc/prometheus/prometheus.yml'
Now, Prometheus will pass the endpoints to the Blackbox Exporter and collect the data. If you run the Compose setup and give it a minute or two to let Prometheus and Blackbox Exporter generate and collect the data, you can then query the probe_success{} metric in your Prometheus dashboard.
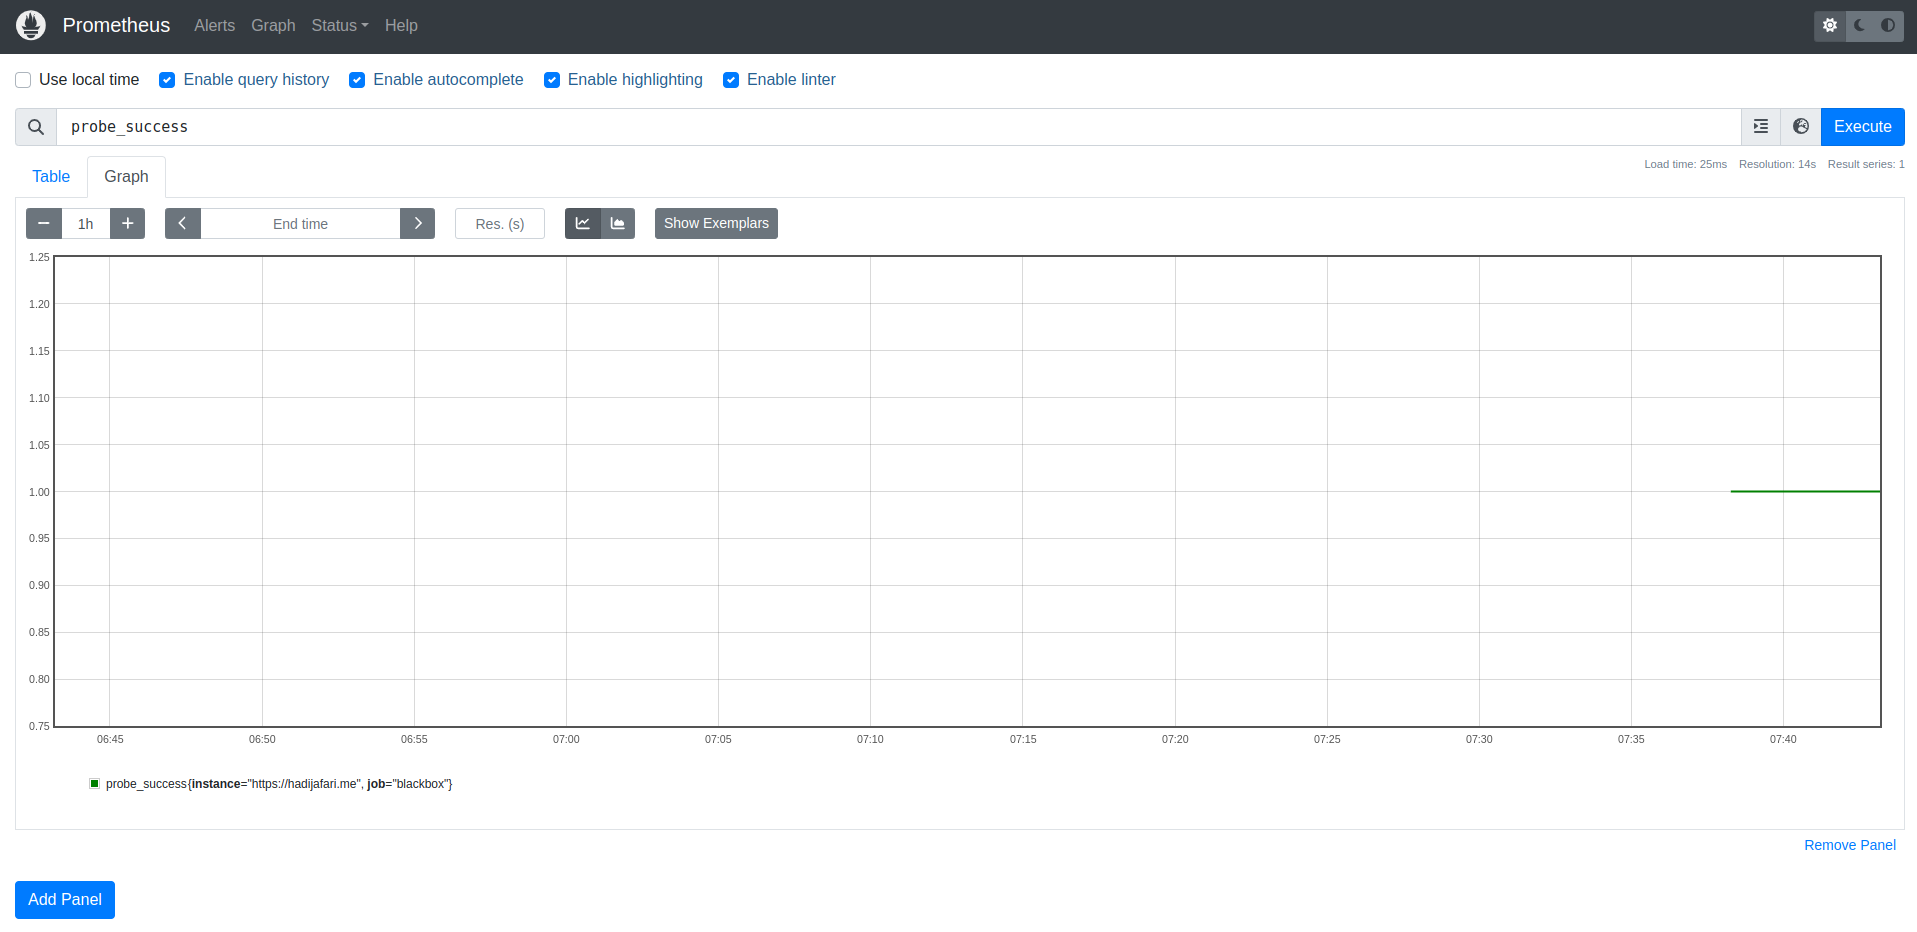
You should see something like this: The probe_success{} metric will be 1 if the probe passes, and 0 if the probe fails.
Now, we can check our downtime through the Prometheus dashboard. Let’s dive a little deeper and understand how all of this works. If you open the Blackbox Exporter’s port in your browser, you should see something like this:
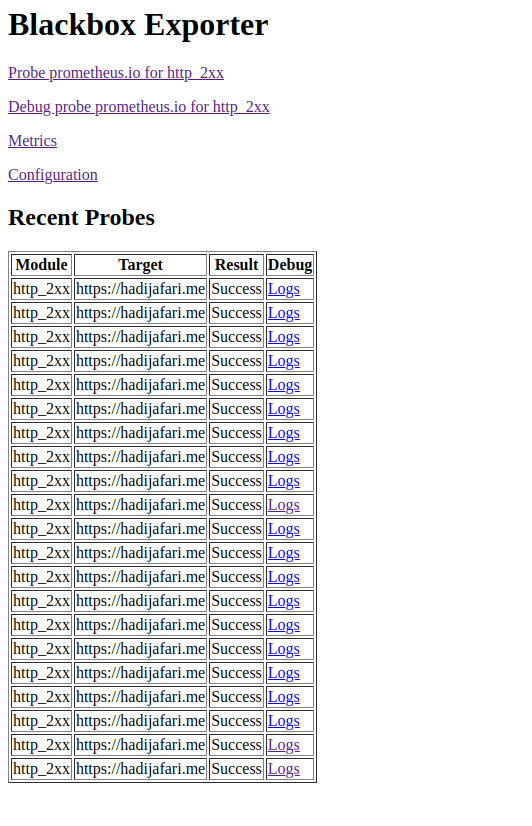
These are all the calls made by the Blackbox Exporter. Now, let’s find out where the data that Prometheus collects is stored. Open the URL /probe?target=https://hadijafari.me&module=http_2xx on your Blackbox Exporter, and you should see something like this:
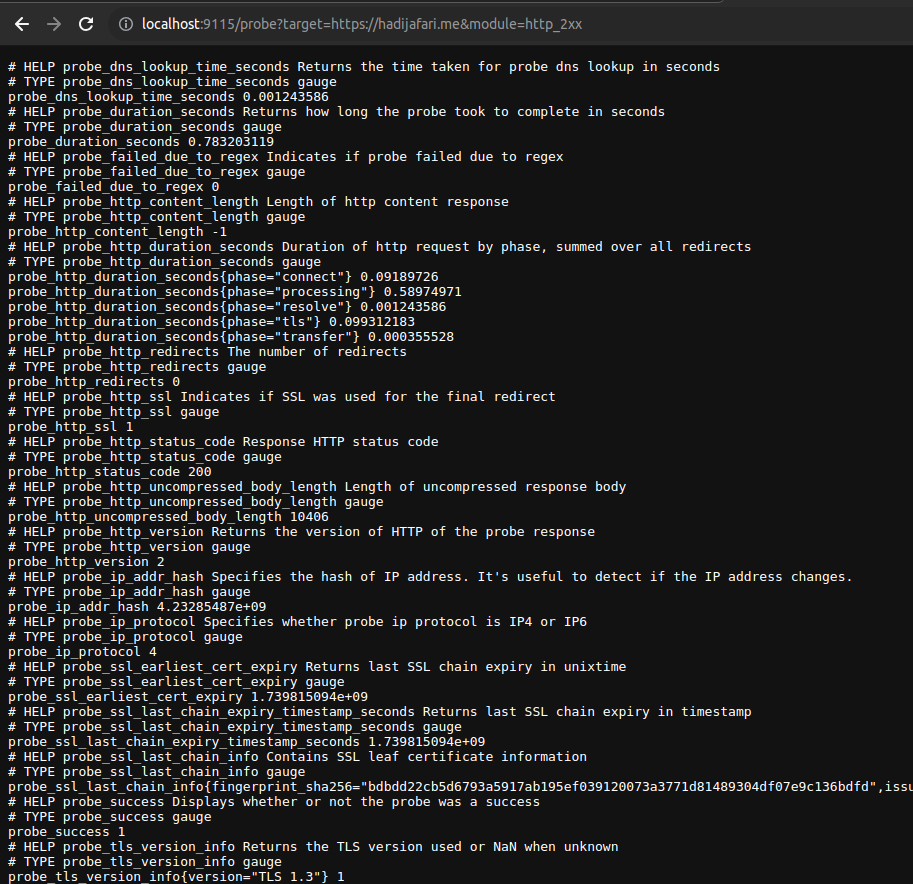
This is the OpenMetrics format, which I’ll explain in more detail in future posts. For now, you can see the data that the Blackbox Exporter provides for each target. For example, you’ll see the probe_success metric that we used earlier, or probe_ssl_earliest_cert_expiry, which shows your SSL certificate’s expiration date, or probe_http_status_code, which indicates the HTTP status code. You can query all of these metrics from the Prometheus dashboard.
We’re done! Now, we have the data in a time-series format that shows the status of our services over time. To take this a step further, you can create Grafana dashboards based on these metrics or configure alerts to be notified about your service status. To make this more production-ready, you can deploy multiple Blackbox Exporters across different network providers and regions to monitor your services' availability globally.
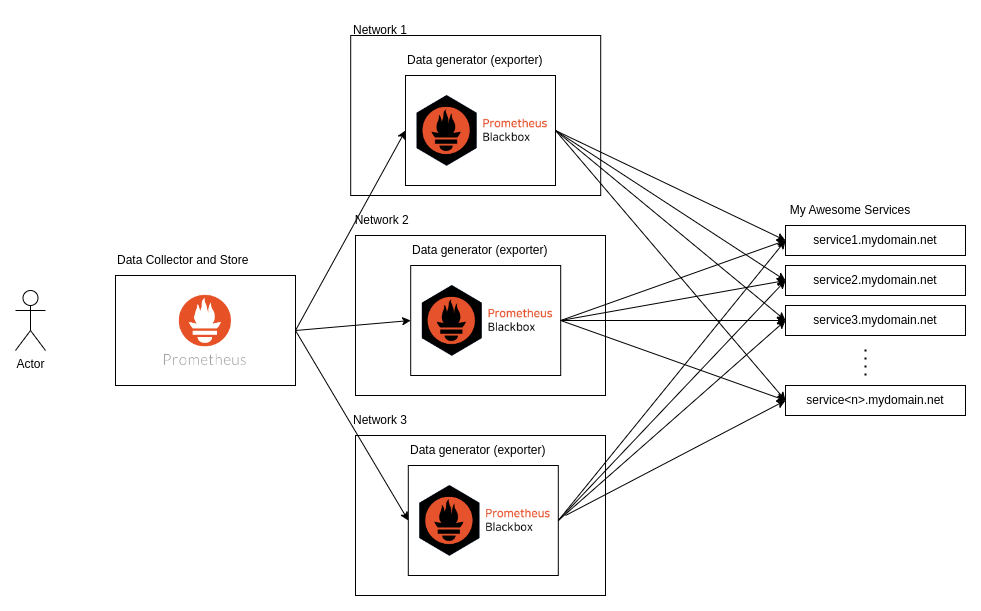
To add more details, you could write an API for your Blackbox probes that checks the status of all your internal services and responds with their availability. For example, in our case, we created an API with authentication that sends empty requests to all our internal services, including the database, to check if they are available or not.
Conclusion
Heartbeat Monitoring is one of the most basic types of application monitoring that I believe every service should have. It helps you respond quickly to service downtimes, notifies users, and reduces customer service calls. Additionally, it allows you to generate reports based on the data, helping you calculate your uptime, continuously improve it, and minimize downtime as much as possible.
Thanks for reading! I’d love to hear your feedback on my blog posts and any suggestions on how I can make them better and more useful. I hope you enjoyed it!
